
I don’t know who is advising Ed Miliband but “public spending back to 1930s levels” wasn’t a good line.
It’s true that the Conservative’s proposed cuts take public spending to its lowest percentage of GDP since the ONS records began but it has been at similar levels in the recent past, notably under Tony Blair in 2000.

Inevitably, therefore, people would say “Well it was like that under your lot and the world didn’t fall apart.” That’s pretty much what Robert Peston skewered him with in an interview yesterday and what John Rentoul was tweeting all afternoon.
But quoting overall levels of spending to GDP misses the point. It was a very different world in 2000. Nowadays we have pressures on public spending that didn’t exist back then. Increasing pensioner benefit costs, state-funded low wage jobs and subsidised housing leave us with a seemingly intractable social security bill. That and the rising public debt payments eat up a lot of our public spending, so, without tax increases, the cost of deficit reduction must fall on public services. (For some detail behind this see here and here.)

The result is that a 4.7 percent real-terms cut in overall spending since 2010 becomes a 25 percent cut in public service spending. Take out capital spending and look at day-to-day service spending and the cut rises to 27 percent. But the population is rising too so that translates to 31 percent per capita. Because some departments are protected and have their budgets maintained, everything that isn’t health or education faces cuts of around 57 percent. An overall cut of just under 5 percent therefore gets amplified because of other spending pressures.
That might be a bit too complex a message to reduce to political soundbites but three charts from the OBR report last week make the government’s plans very clear.
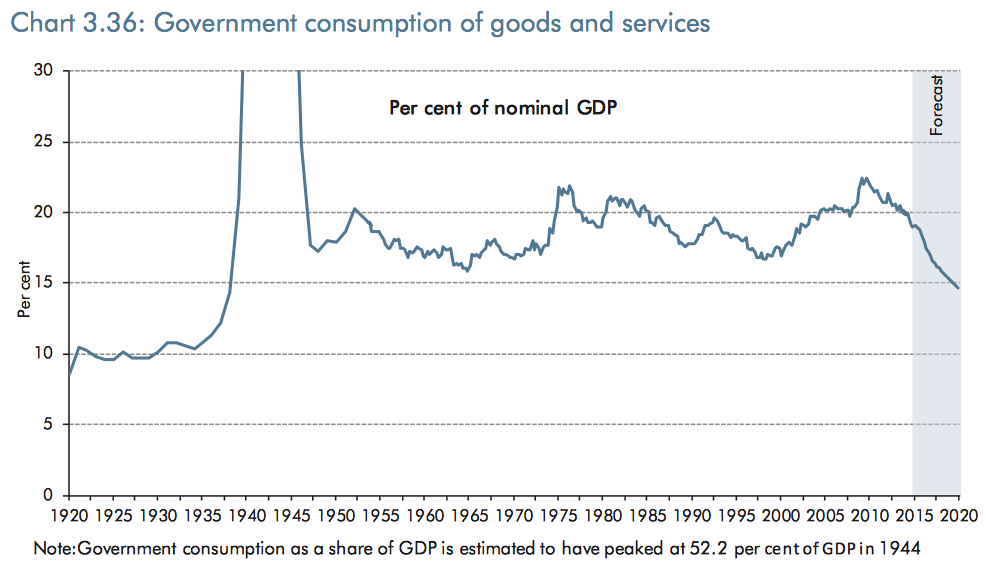
1. Public service spending falls to its lowest level since 1938
The ONS record only go back to 1948 but the Bank of England’s measure of government consumption, a rough proxy for public service spending, goes back further. This shows overall public service spending falling to a share of GDP last seen in 1938.
This is the opposition’s 1930s message. It’s not public spending, it’s public service spending that falls to 1930s levels
2. Day to day public service spending falls to its lowest level since records began

The ONS records don’t go back far enough to find a time when day-to-day spending was at 12.6 percent of GDP. This amounts to real-terms per capita cuts of a third at a time when an ageing population means the number of people needing help from the state is increasing.
3. Spending on everything outside health and education is cut by more than half
Because health and education are protected (and international aid but that’s piddling), real-terms per-capita cuts to everything else are close to 60 percent.
That includes defence and policing (to worry the traditional conservatives) and social services (to worry the lefties).
It’s clear from this that a lot of local government services will simply cease to exist.

No wonder, then, that the Chief Constable of Lincolnshire is warning that his force will fall apart within the next few years.
And that’s pretty much it. Ed Miliband shouldn’t get into discussions about overall public spending because it doesn’t look as if it falls by very much (5 percent doesn’t sound a lot) and it was at similar levels relative to GDP when his lot were in power. He should, instead, focus on the threat to public services.
Last week, George Osborne was rattled by comments from the Institute for Fiscal Studies and, by implication, the forecasts of the OBR. He will probably be less rattled by Ed Miliband’s speech.
Simply by stating the implications of his plans, impartial (or as near is it gets) technocrats are landing stronger punches on the Chancellor than the leader of the opposition. If Ed Miliband is to have a hope of winning the election, he needs to make his punching sharper.
Update: Maybe I’m being a bit harsh. Ed Miliband did say 1930s public services spending at one point in this speech but it then gets muddied by references just to 1930s public spending. He also didn’t make the distinction when Robert Peston questioned him on it.
Update 2: Jargon Buster
TME = Total Managed Expenditure, total government spending
AME = Annually Managed Expenditure, mostly social security, plus debt interest
DEL = Departmental Expenditure Limits, total central government spending on public services (local governemnt council tax revenues are in addition to this)
RDEL = Resource DEL, day-to-day spending on public services (so excluding capital spending)


Robert Peston and John Rentoul must both have short memories.
The incoming Labour government of 1997 pledged to stick to Tory plans for public spending for the first 2 years, which they did. The year 1999/2000 is just one year on from that commitment but even then Gordon Brown was a prudent (read tight-fisted) chancellor. Times for the public sector were hard during that period. Those who were aware at the time of the John Major government will remember the awful state of the public sector due to the never-ending cuts inflicted on it. .
Does no-one remember how John Major’s declared aim to create a “classless society” was turned against him to describe the near collapse some of state schools? Or the patients waiting on trolleys in NHS hospitals? And myriad other difficulties with accessing public services?
Peston is a good journalist and writer but I am afraid he and John Rentoul mislead when they imply that the “world did not fall in” in 2000. It almost did under Major’s government and not much was different in those early years of the 1997 Labour administration..Brown took his foot off the brake only some years later.
This sounds interesting, but the main point of this blog is lost on me because I don’t understand the abbreviations in the bar/line chart in the middle of this blog (TME/DEL/RM etc). Could you enlighten? Thanks.
Sorry Tracey, should have included a jargon-buster.
TME = Total Managed Expenditure, total government spending
AME = Annually Managed Expenditure, mostly social security, plus debt interest
DEL = Departmental Expenditure Limits, total central govt spending on public services (local govt council tax revenues are in addition to this)
RDEL = Resource DEL, day-to-day spending on public services, so not including capital spending
Hope that helps.
Well said theuxbridgegraduate, I was thinking the same thing reading this.
New Labour was stupid to stick to Tory spending plans (and rightly heavily invested thereafter) – but Balls is even more stupid to stick to Osborne’s plans in 2015-16.
Reblogged this on sdbast.
The IEA has found that governments of all hues within living memory have only ever succeeded in taking 37% of GDP in taxation, however hard they’ve tried.
http://www.iea.org.uk/in-the-media/media-coverage/we-need-to-take-a-long-hard-look-at-government-spending
Ergo, might it make sense to set, say 35% of GDP as a sensible limit on government spending? (thus allowing a small year on year surplus with the other 2%, for emergencies and debt reduction). That would be honest, responsible to as yet unborn generations whom we’re currently saddling with our debt burden, and allow an honest debate that makes plain the choices that will be required.
Politicians that promise you can “have it all” because ‘we print the money’ should consider this.
P Hearn – This is a great point. Over the long run we have to live within our means, and accept that we can’t have everything we want.
Actually when I look at Rick’s local authority spending chart I see plenty of areas for cuts, like “cultural services”, “regulatory services” and so on. I also bet there is large inefficiencies and wastage as well in all categories. My experience of all organisations is that if you protect their budget they accumulate inefficiencies. If you force their budget lower, lo and behold savings can always can be found. The private sector continually has to innovate and raise productivity year in and year out. Why can’t the public sector do this as well?
Land value taxes.
Can’t fault that P Hearn . Absurd uxbridgegraduate to refer to excessive spending by Brown as “taking his foot of the brake” . One would need brakes if there was pressure caused by a surplus of income over expenditure but , to continue the silly theme , when Brown jammed his boot on the accelerator of spending it merely sucked on an empty tank . The resultant borrowing to fill the vacuum got us to precisely where we are . The Labour Party must bless the day that Lehman Brothers et al screwed up and provided the perfect fall guys . Debt fuelled financing eh ? I guess it’s always tempting to believe that someone else really will pay but irresponsible to the point of criminal to laden taxpayers yet to come with it , as you rightly say PH .
The UK was one of the only countries to avoid the early 2000s recession.
There are many good reasons to criticise Brown, like his insane PFI schemes, but this is not one.
The UK could not keep running surpluses, it would have made household borrowing even worse.
The UK was one of the only countries to avoid the early 2000’s recession because the then government followed much the same policy as the previous one . But I can’t agree about the (more or less) balanced budgets . Agreed there’s no need for big surpluses (which there weren’t) , but preferable to the populist massive monthly deficits Mr Brown ran which were always going to be the trouble in the future they proved to be . Unlike many here I contend that wile national budgets are not like household budgets , there’s more similarities than differences and I don’t think any party has a monopoly on competence with them .
The economist has been spinning this line:
http://www.economist.com/blogs/freeexchange/2014/12/public-spending-britain
Having checked one or two statements (as best I can) I wouldn’t call that a ‘spin’ . More , another view of a complex issue muddied yet again by an overexcited party political headline grab (Labour this time) . Wouldn’t it be good if all the talk of ‘grown up’ discussion on the ‘issues’ facing ‘hard working families’ could come to something and they (all of them) ceased being so insulting . We don’t all take the Sun Mirror etc ……well only for the sport of course !
Pingback: Planned future spending cuts return us to the Geddes Axe of the 1920s | ToUChstone blog
Pingback: Taxing times: it's not just the extent of Osborne's proposed spending cuts that is wrong
Pingback: News: Real Estate, Risk, Economics. Dec. 13, 2014 | PropertyPak.com®